与他人分享
我们已经可以用 pyecharts, jupyter-noteook 把紫禁城画出来了。可以在与 别人分享的时候,我们不能用 127.0.0.1,而是需要一个公共服务器。
挂在 github 上
echart-maps 里的所有 js 文件其实都是关在 github 上的。
-
先在本地创建一个 git 项目.
$ git init$ git add .$ git commit -am "initial comment" -
然后把这个项目放到 github 里
-
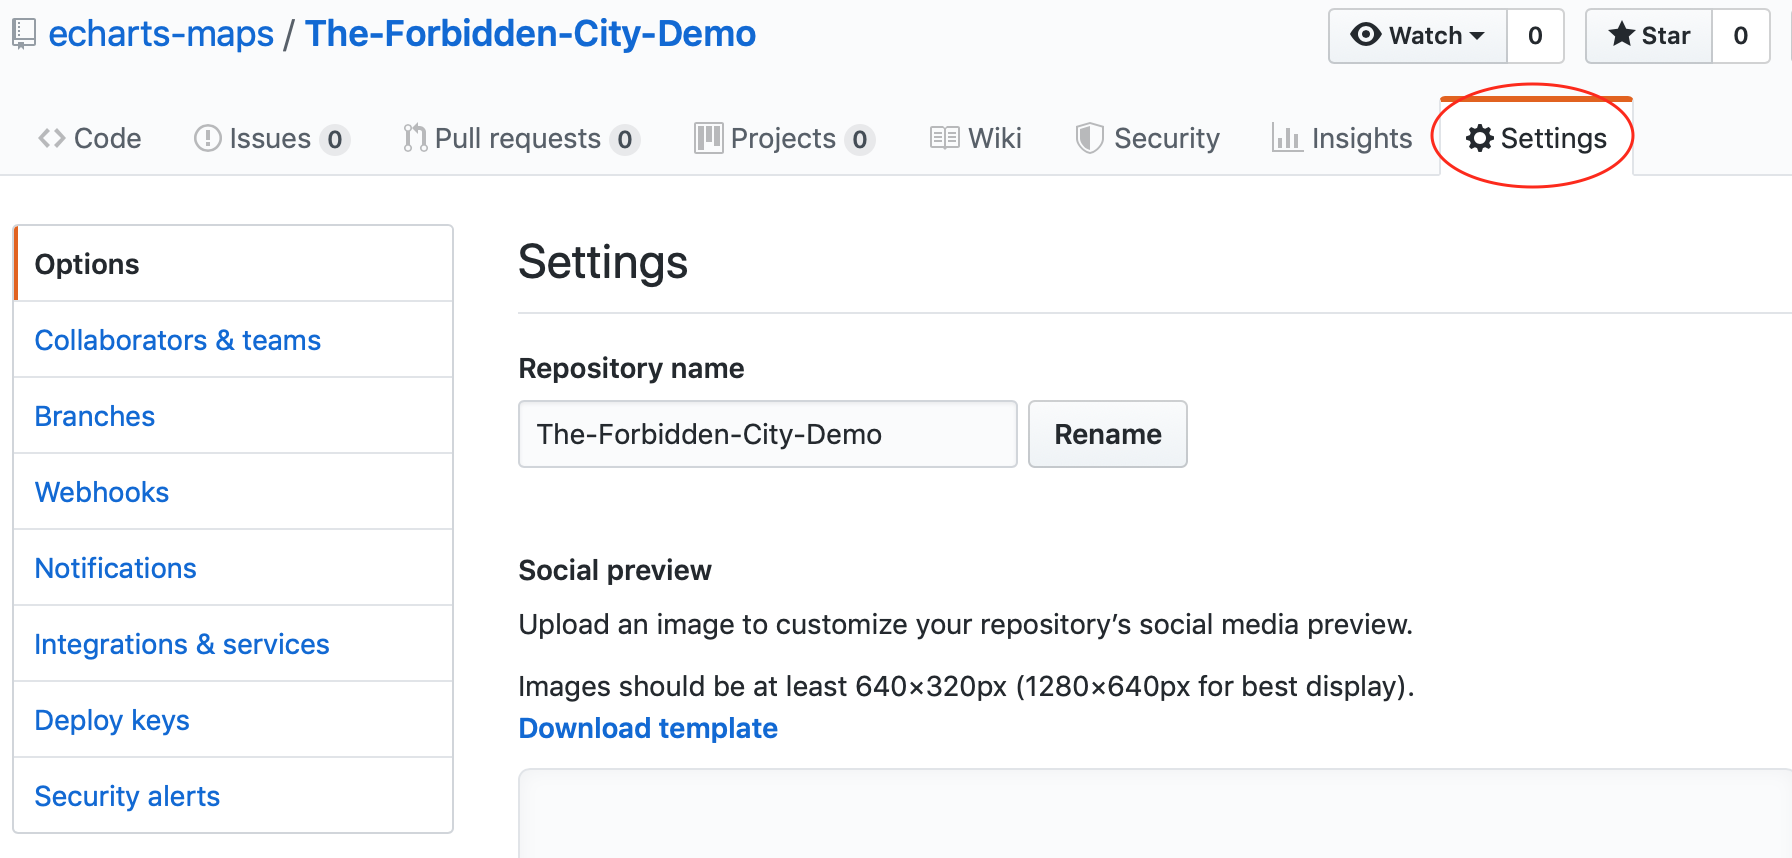
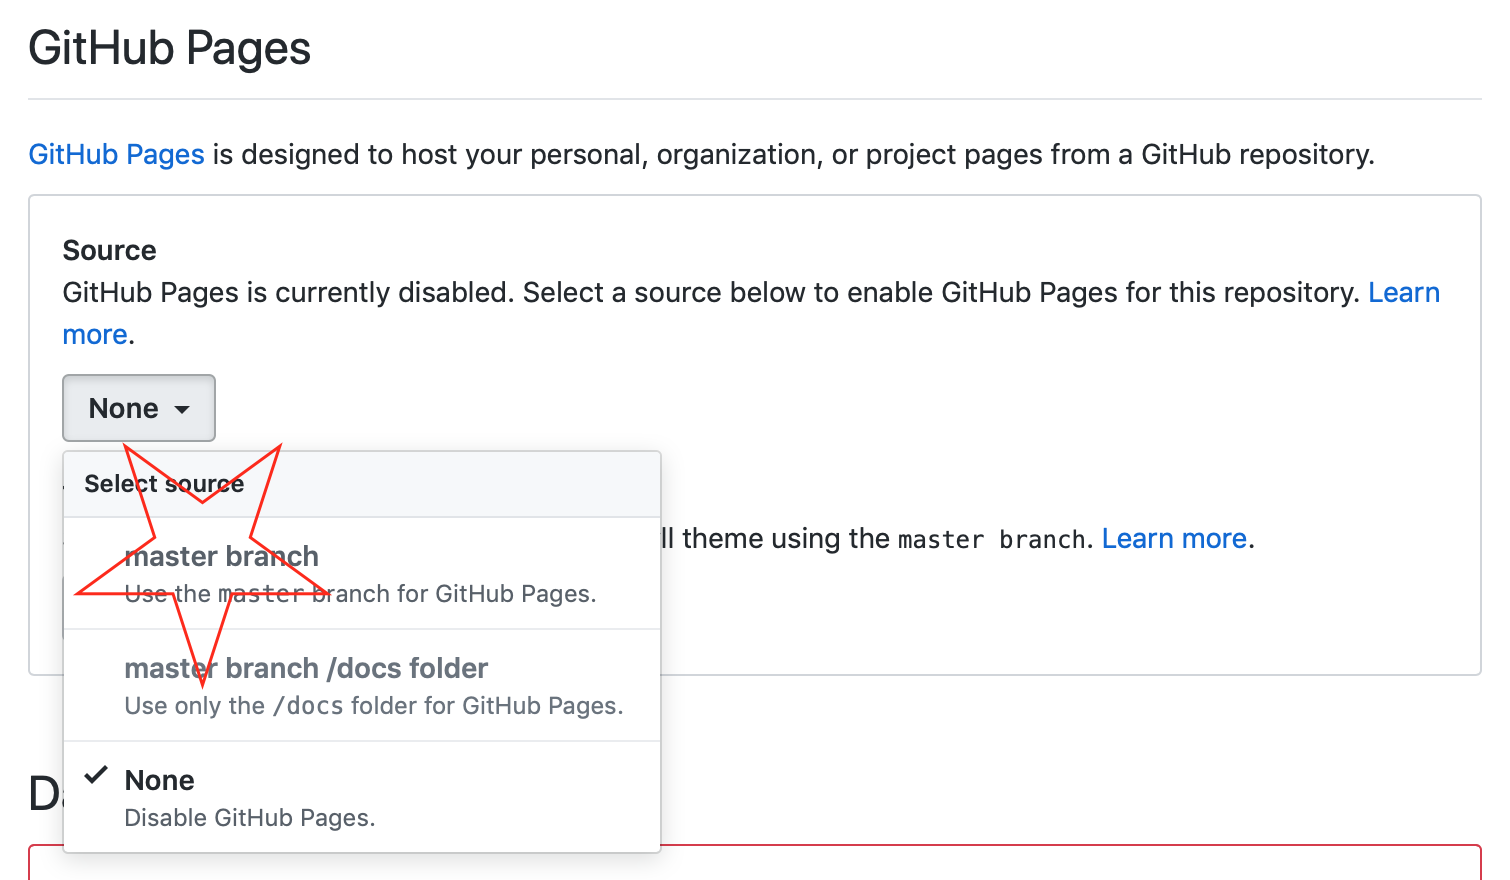
在 github 的项目设定列开启 github pages:
-
这个截屏告诉你是怎么做的:
-
稍等一下,你的 github pages 就可以用了。
然后更新所有的代码:
from pyecharts import options as opts
from pyecharts.charts import Geo
from pyecharts.datasets import register_url

register_url("https://echarts-maps.github.io/The-Forbidden-City-Demo") # <--

g = (
       Geo()
        .add_schema(maptype="The Forbidden City")
        .set_global_opts(
            title_opts=opts.TitleOpts(title="The Forbidden City in Beijing"),
        )
)
g.render()
现在可以分享了
- 如果是
render.html的话,你可以直接放在你的 github 项目里,就像这样: https://echarts-maps.github.io/The-Forbidden-City-Demo/render.html -
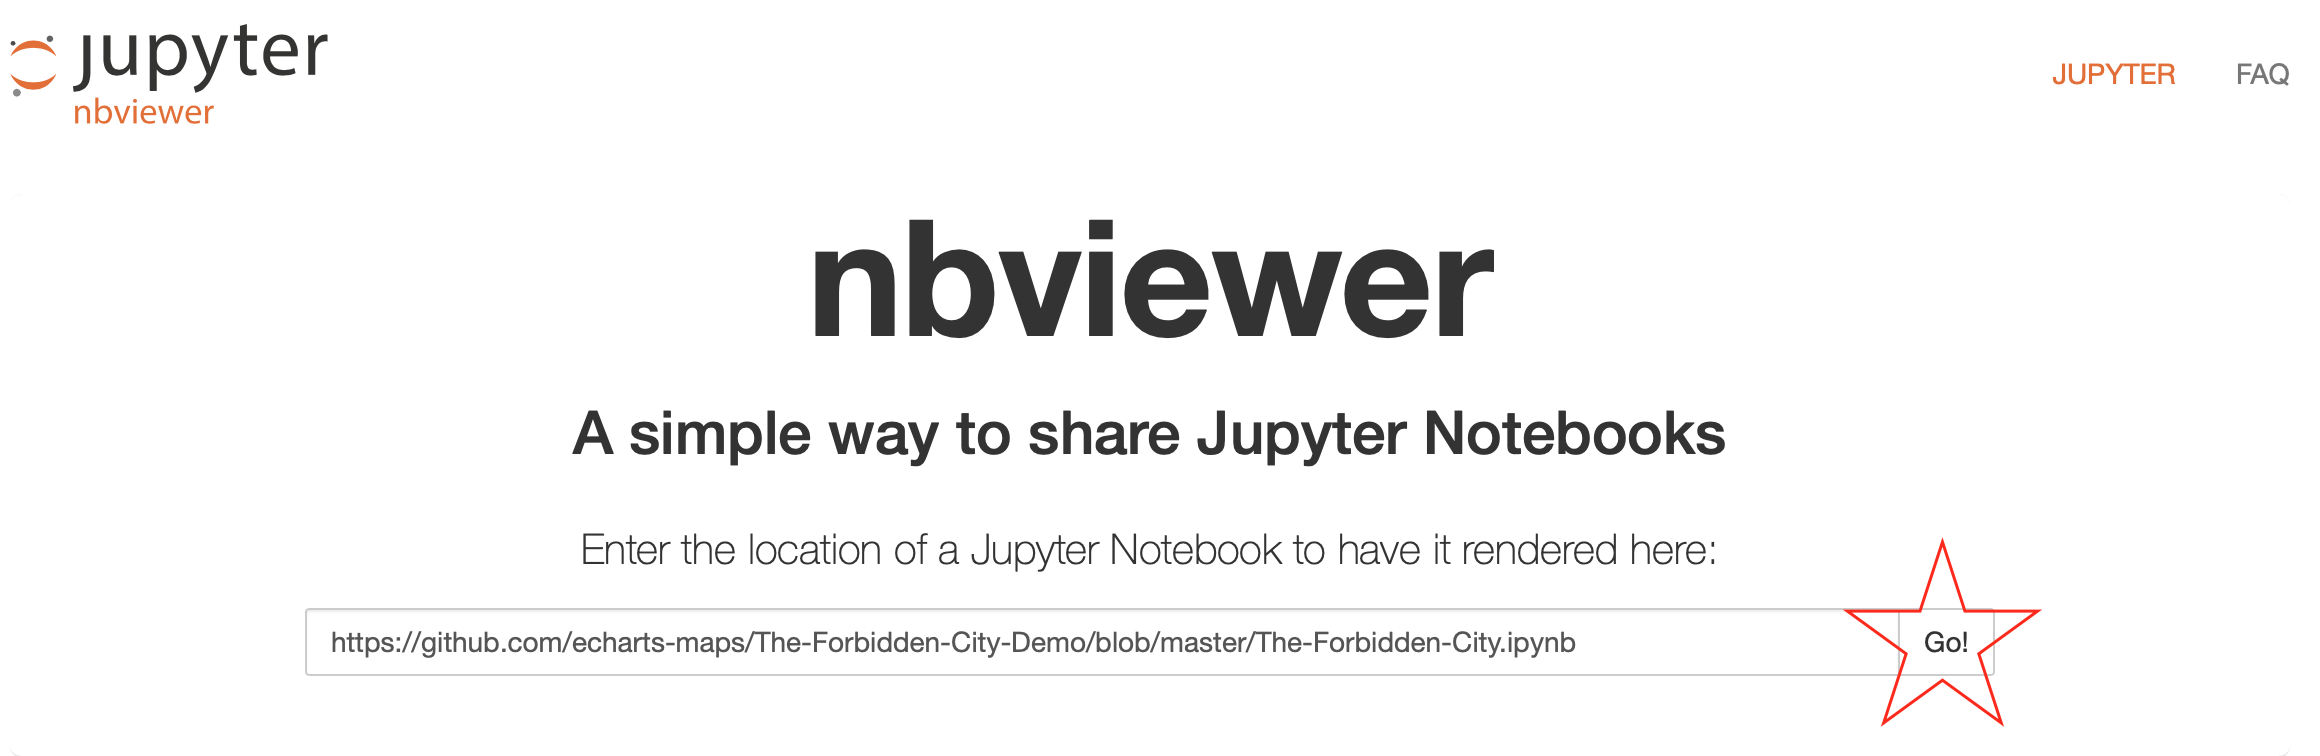
如果是 jupyter notebook 的画,你可以通过 https://nbviewer.jupyter.org 分享。 看这个 例子.
-
看这个渲染效果:
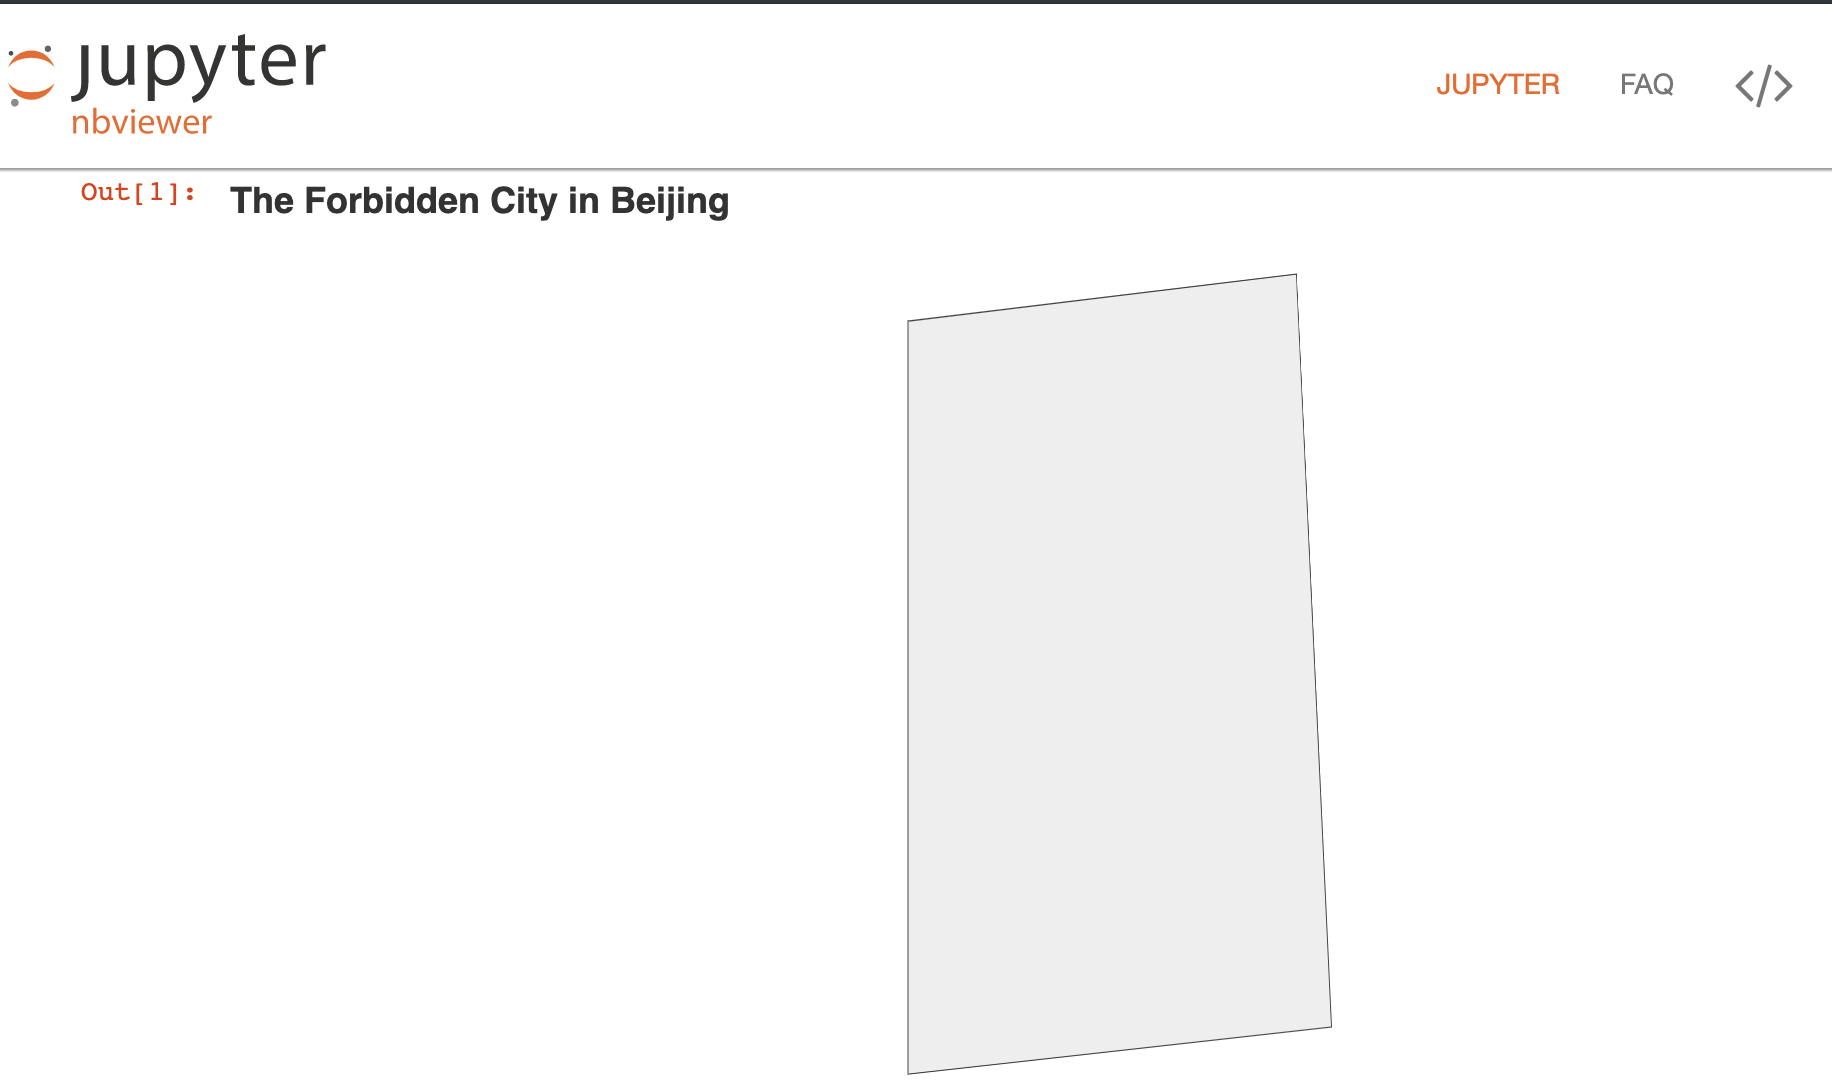
请注意,在用 jupyter-notebook viewer 的时候,时间有延迟。比如我这链接,我等了 24 小时 才得到应该有的效果。
其他的分享途径
- 发布到 npm 然后用 unpkg.com
- 发在阿里云上