Where do the county maps come from?
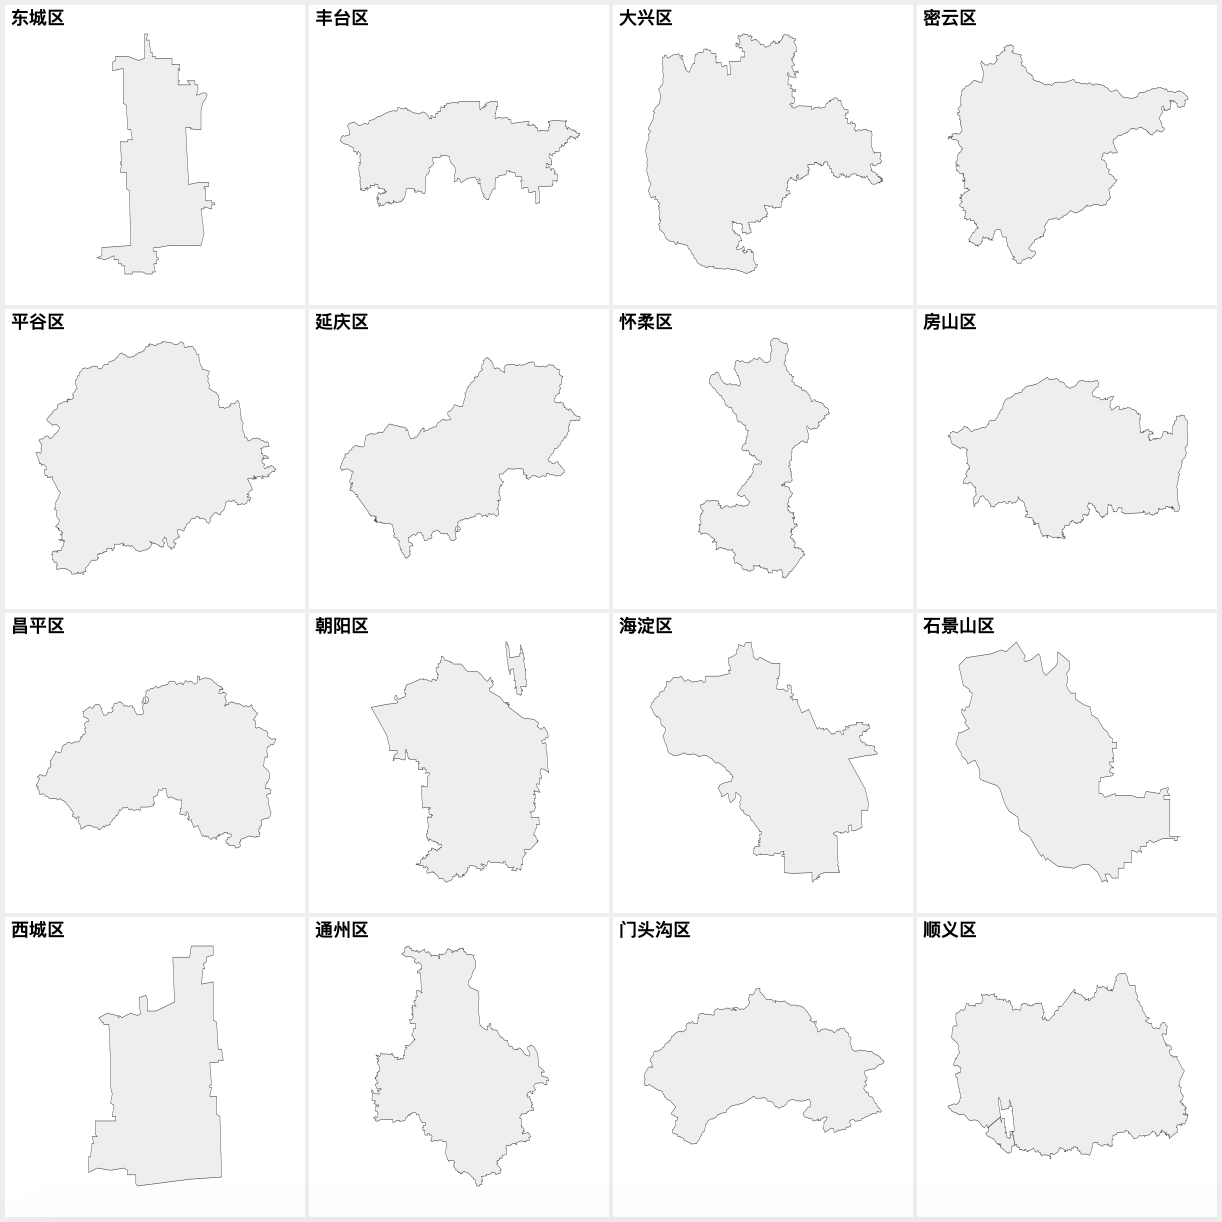
Simply, they are splited from city maps. Take Bejing as an example, its own map
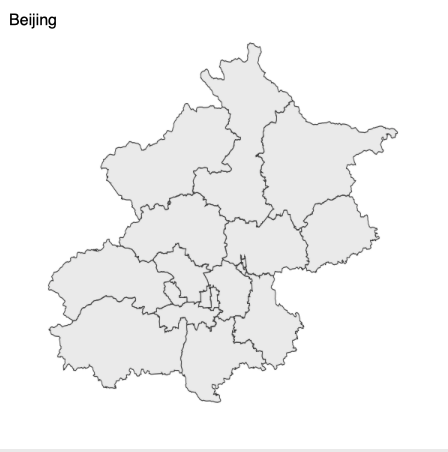
could be splitted into the following independent shapes:
Theory
geojson is a json file and can be edited by any json editor. Let drop Beijing geojson file into json editor online.
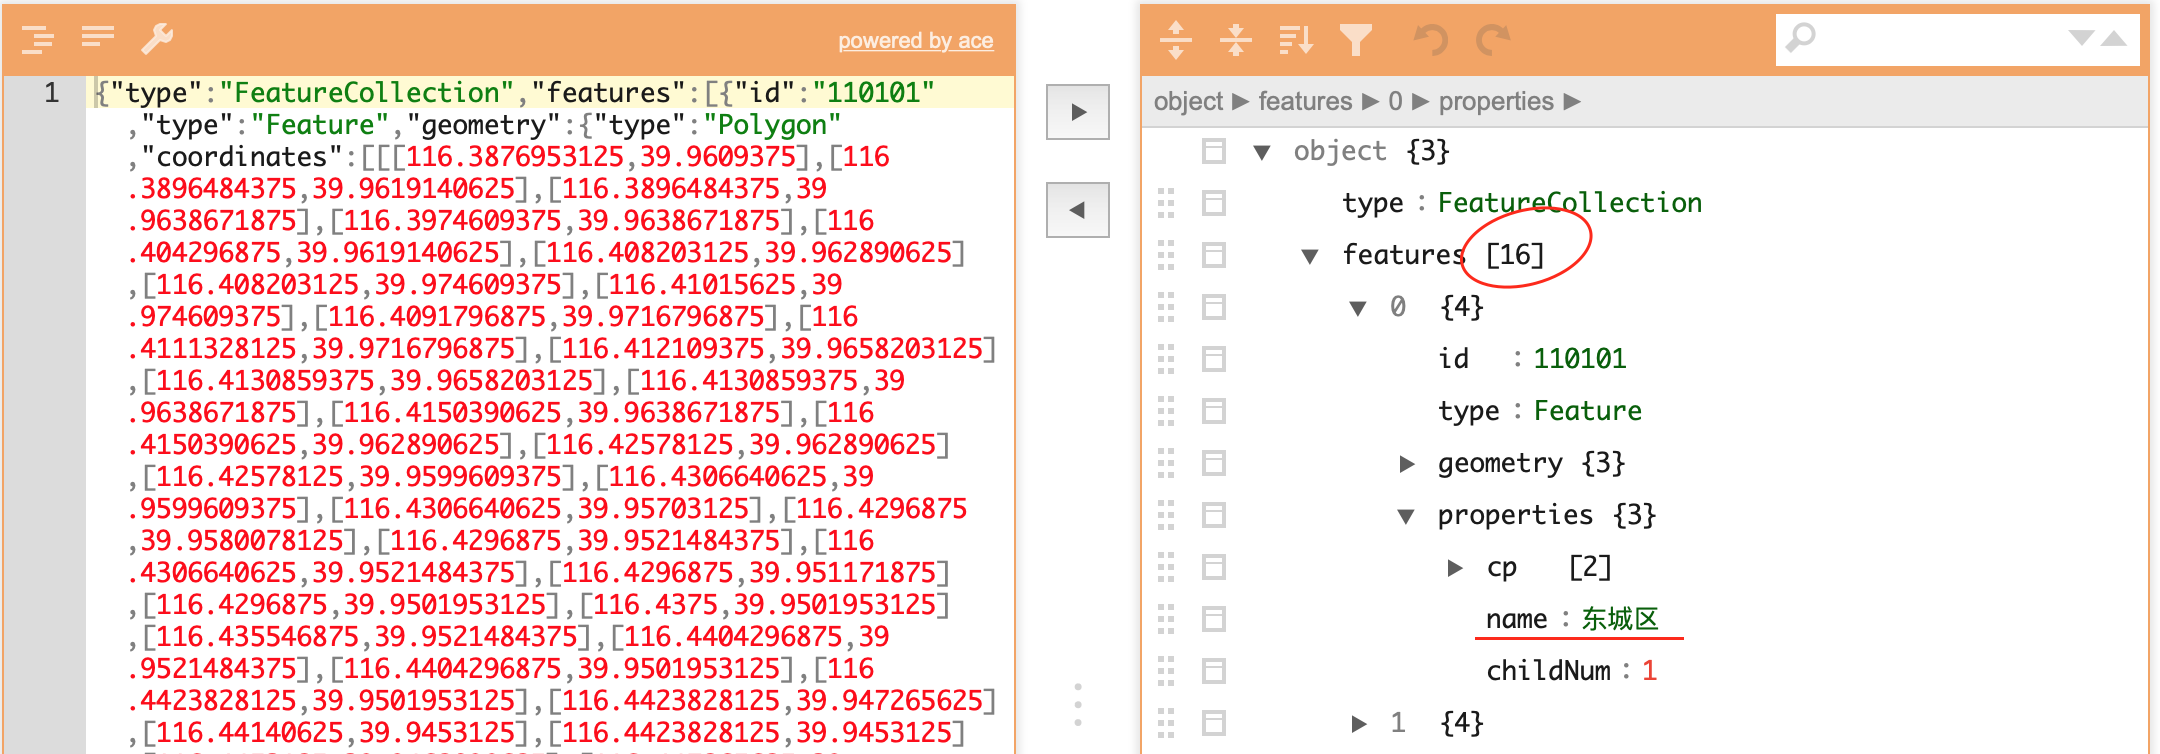
You will find that it consists of 16 geojson features. The first one is called “东城区”
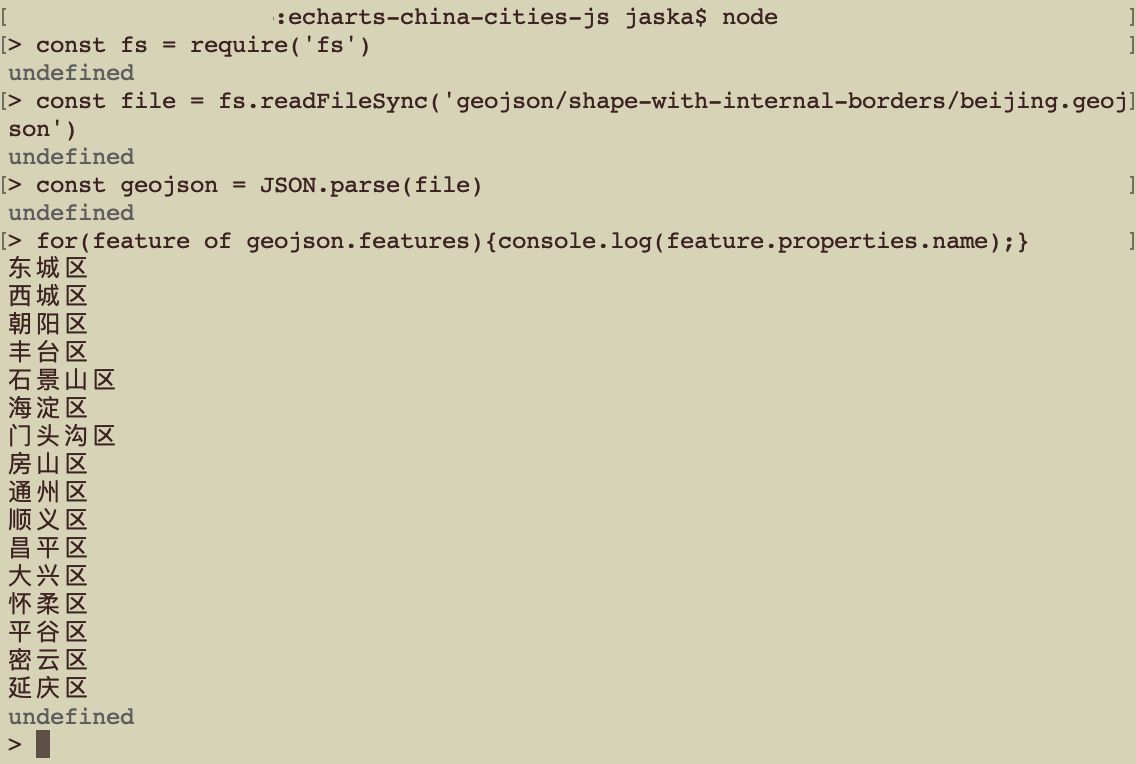
If you have node, we can have a programmatic inspection:
One step operation
Now let use echarts-mapmaker's split:
$ split geojson/shape-with-internal-borders/beijing.json
$ ls
东城区.geojson     怀柔区.geojson     通州区.geojson
丰台区.geojson     房山区.geojson     顺义区.geojson
大兴区.geojson     昌平区.geojson     石景山区.geojson
密云区.geojson     朝阳区.geojson     门头沟区.geojson
平谷区.geojson     海淀区.geojson
延庆区.geojson     西城区.geojson
Conclusion
2882 counties, islands and districts were done in this way.